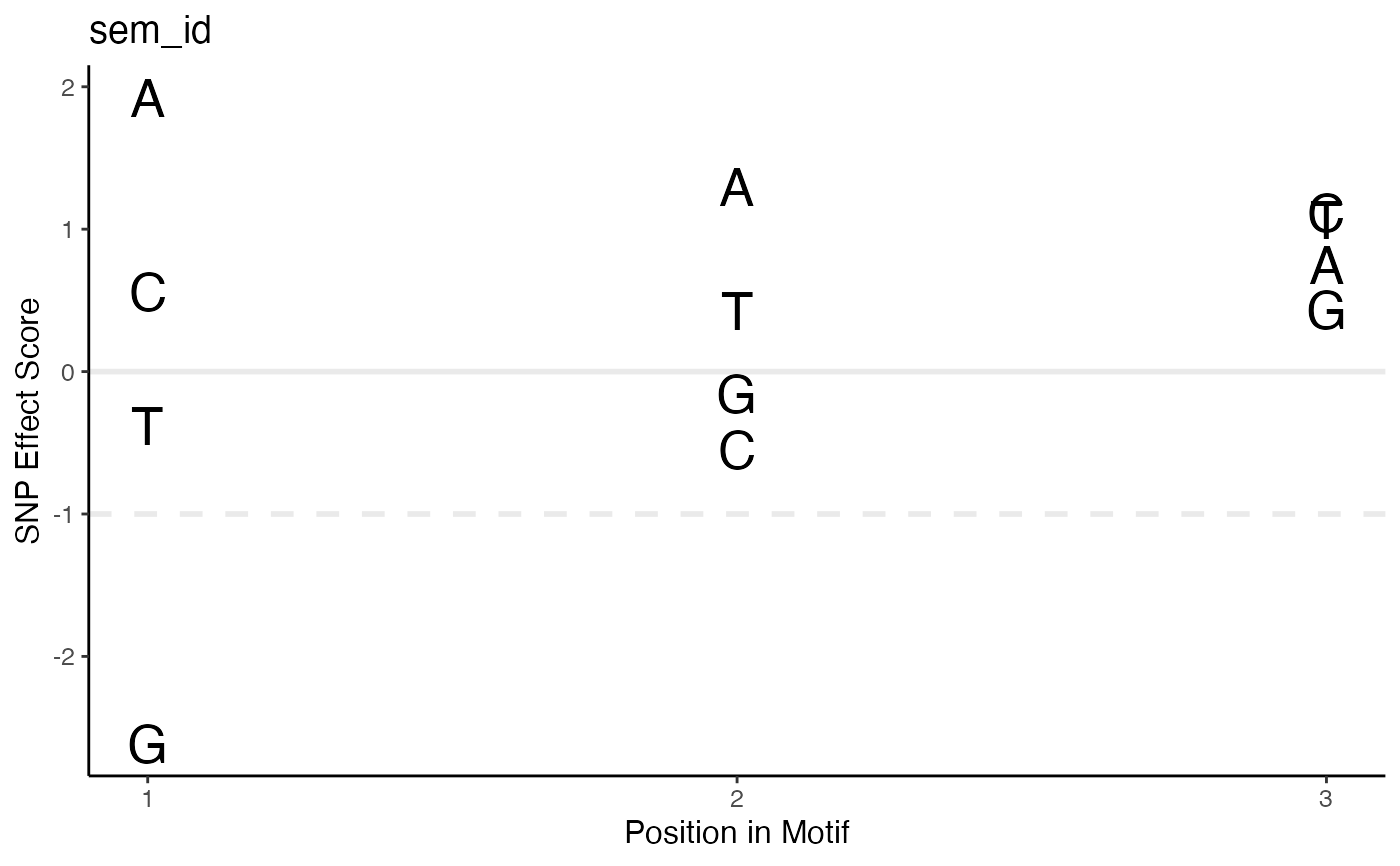
Plot SEM scores for each nucleic acid in each position of the motif
Usage
plotSEM(
  sem,
  motif = NULL,
  motifSeq = NULL,
  cols = c("lightgrey", "dodgerblue"),
  size = 7,
  hindex = NULL,
  hcol = "dodgerblue",
  halpha = 0.1,
  hwidth = 15,
  lcol = "#d7dbdd",
  lwidth = 1
)
Arguments
- sem
A SNPEffectMatrix or SNPEffectMatrixCollection object.
- motif
sem id to plot. If providing a SNPEffectMatrixCollection object, must match a name in the list. If providing a single SNPEffectMatrix object, this parameter is ignored and the SNPEffectMatrix's semId is used for plotting.
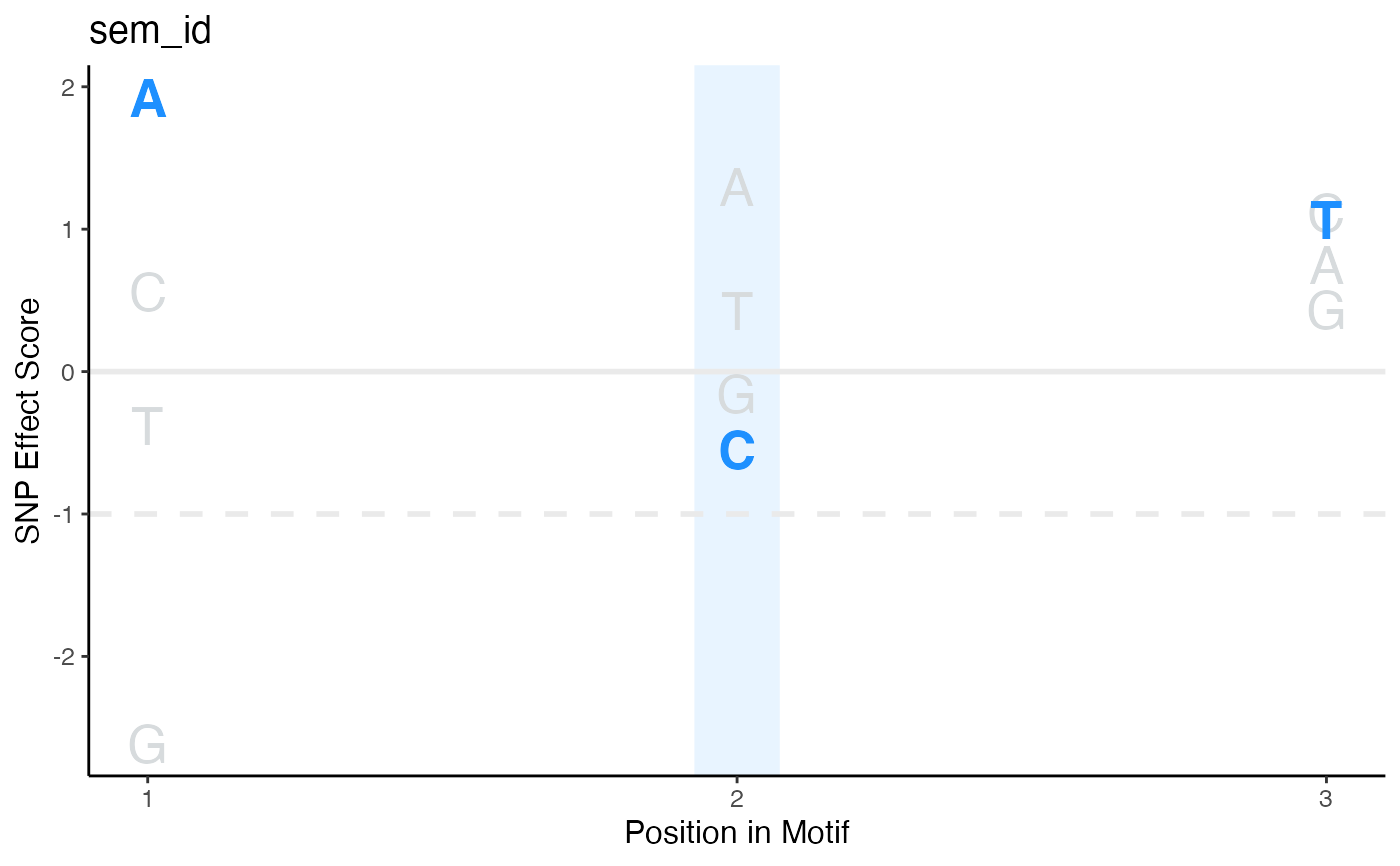
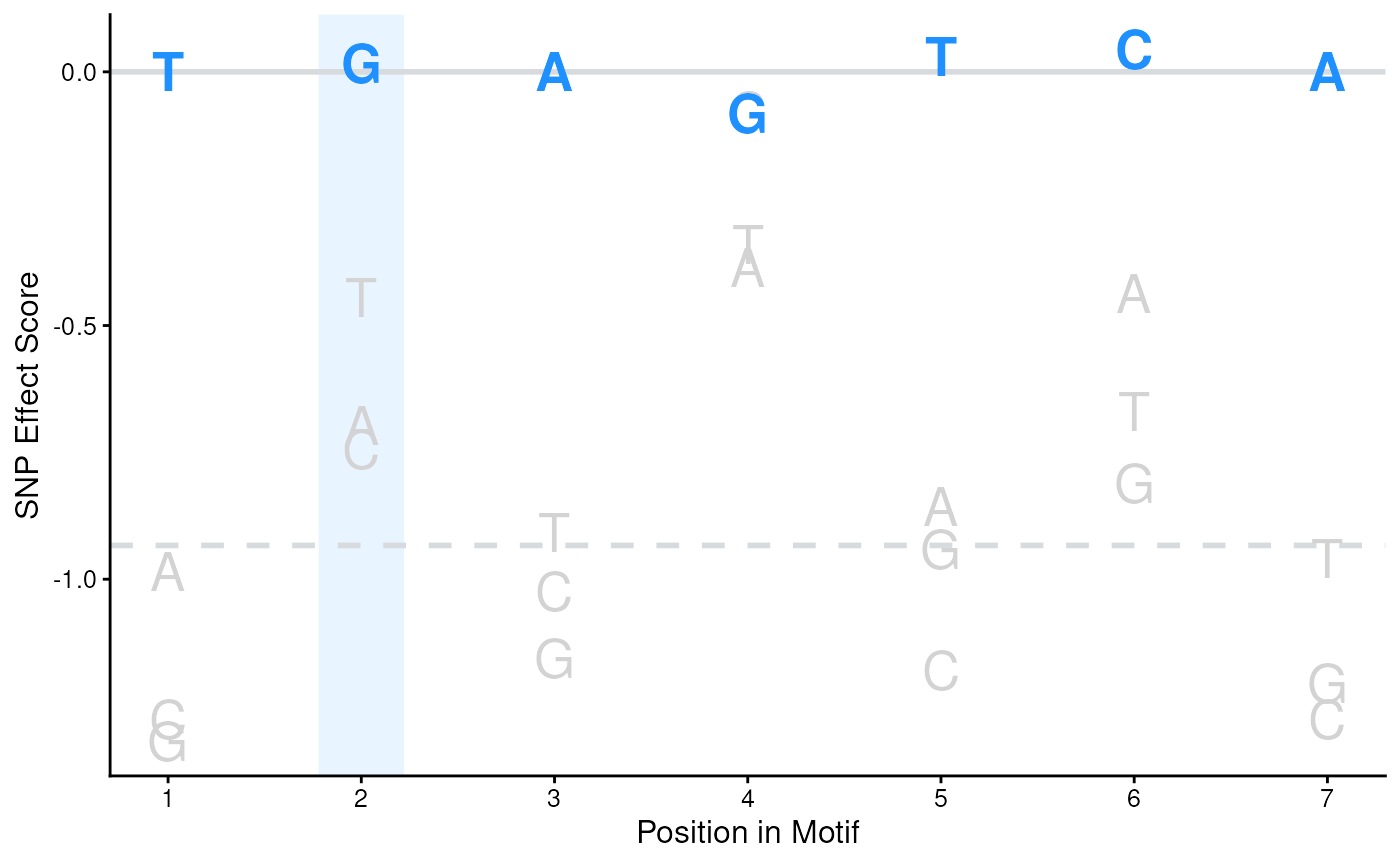
- motifSeq
Character sequence to color on plot
- cols
A vector of two colors to color the nucleotides not included and included in the provided motifSeq respectively
- size
Font size of nucleotides in plot
- hindex
Index of nucleotide to highlight in the motifSeq
- hcol
The color of the vertical highlight bar
- halpha
The alpha transparency of the vertical highlight bar
- hwidth
Width of highlight bar
- lcol
Color of the horizongtal endogenous and background binding lines
- lwidth
Width of the horizontal endogenous and background binding lines