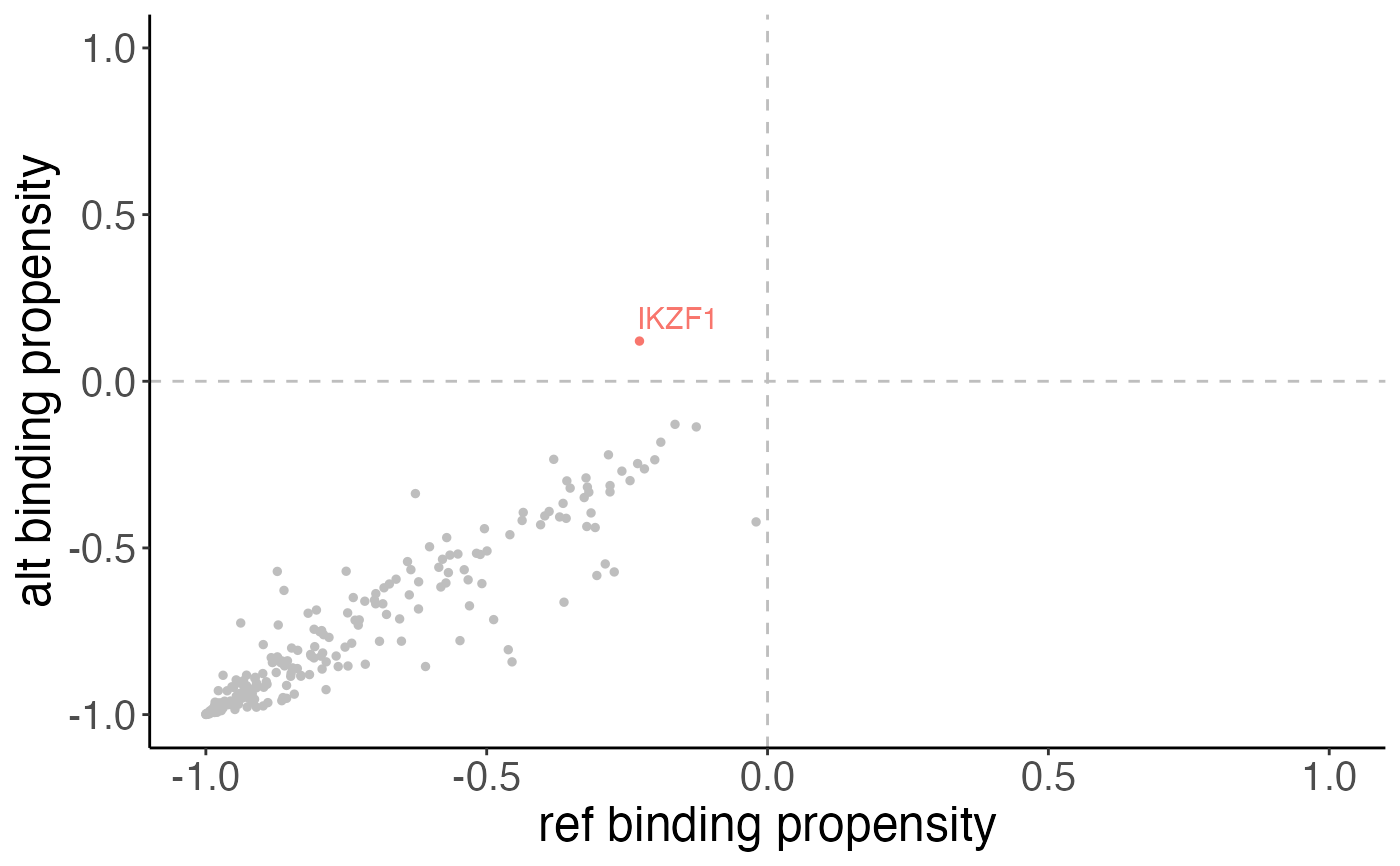
Plot non-alt versus alt binding propensity for a single variant
Source:R/plotSemMotifs.R
plotSemMotifs.RdPlot non-alt versus alt binding propensity for a single variant
Usage
plotSemMotifs(
  semplObj,
  variant,
  label = "semId",
  changedCols = c("#F8766D", "dodgerblue2")
)Examples
library(VariantAnnotation)
data(sc)

# create an SNP Effect Matrix (SEM)
sem <- matrix(rnorm(12), ncol = 4)
colnames(sem) <- c("A", "C", "G", "T")

# create a VRanges object
vr <- VRanges(seqnames = "chr12",
              ranges = 94136009,
              ref = "G", alt = "C")

# calculate binding propensity
s <- scoreVariants(vr, sc, BSgenome.Hsapiens.UCSC.hg19::Hsapiens)

plotSemMotifs(s, "chr12:94136009:G>C", label = "transcription_factor")